Bloghouse
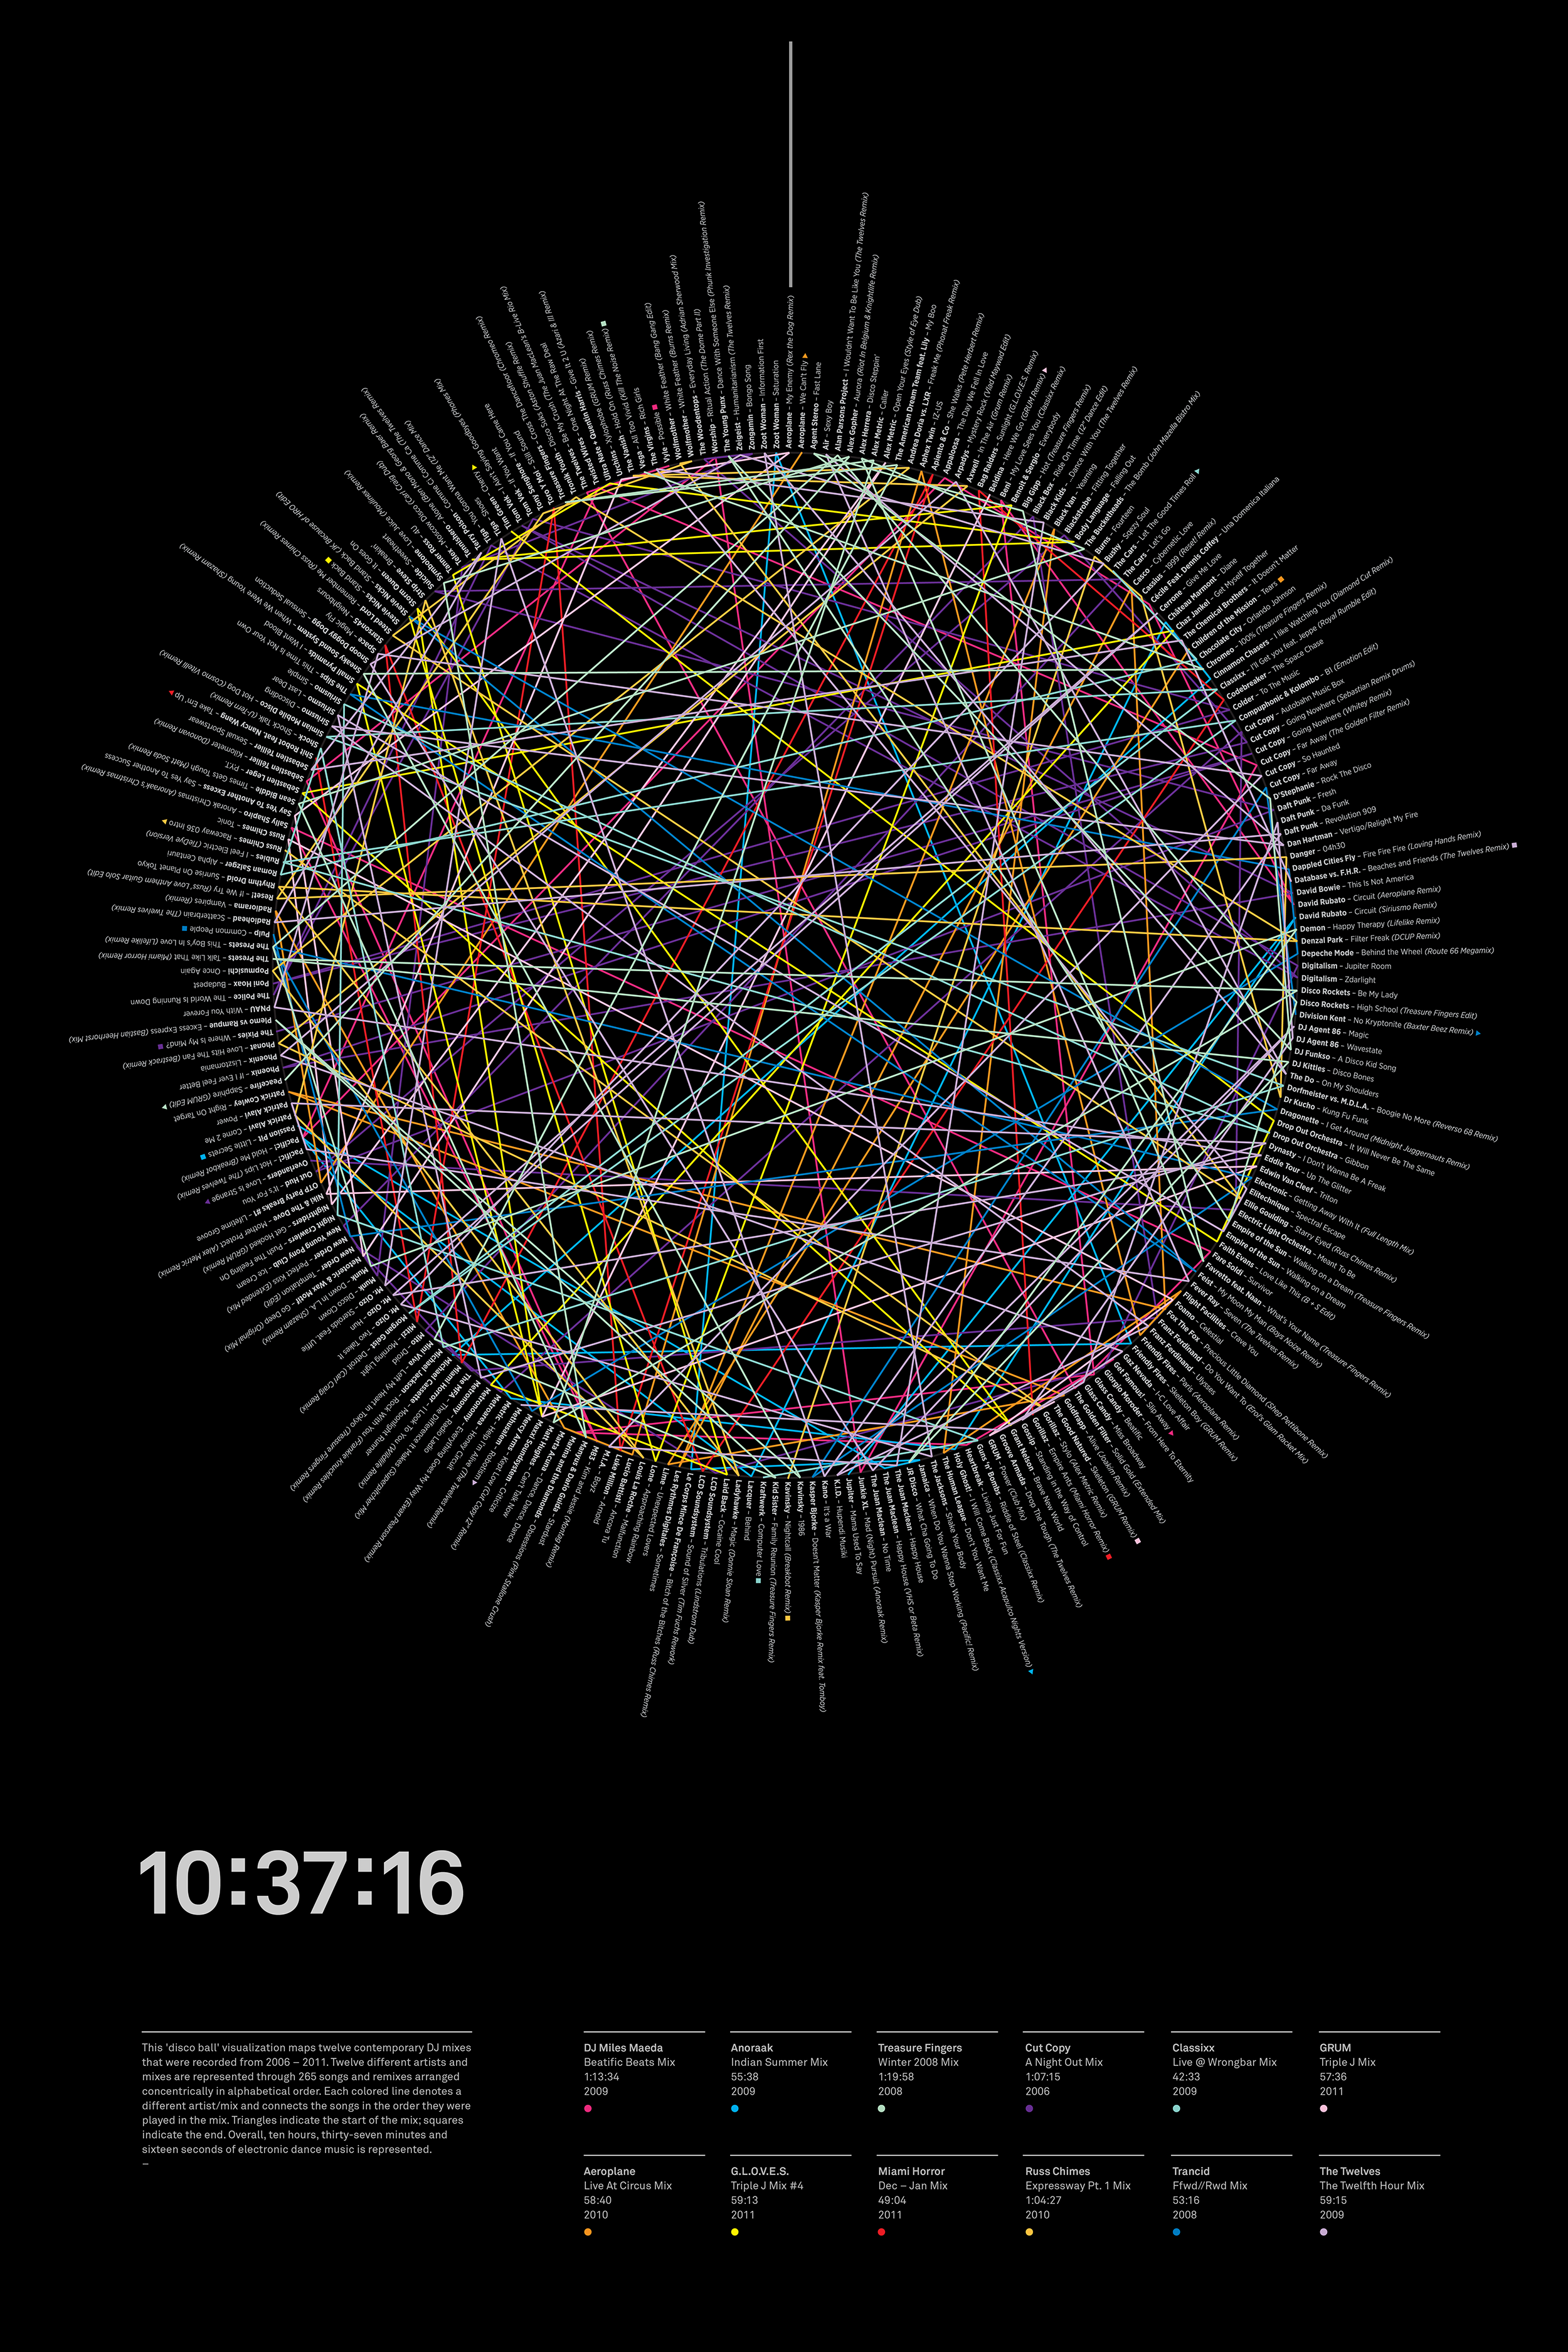
A “discoball” data visualization mapping 12 DJ sets across 10 hours, 37 minutes and 16 seconds of “Bloghouse” electronic dance music.

Agency:
Studio B
(Personal Work)
Type:
Poster Design
Data Visualization
Role:
Art Direction
Design
Studio B
(Personal Work)
Type:
Poster Design
Data Visualization
Role:
Art Direction
Design
Bloghouse was a cultural movment, party scene and electronic dance music microgenre during the mid to late 00’s.
Using a discoball for its strong associations with dance and nightclub culture, this “discoball” data visualization maps twelve contemporary “Bloghouse” DJ mixes that were recorded from 2006 – 2011. Twelve different artists and mixes are represented through 265 songs and remixes arranged concentrically in alphabetical order. Each colored line denotes a different artist/mix and connects the songs in the order they were played in the mix. Triangles indicate the start of the mix; squares indicate the end. Overall, approximately ten hours, thirty-seven minutes and sixteen seconds of electronic dance music is represented.
4-Color Offset Print
24” x 36”